Chapter 8
Integral Calculus and Its Uses
8.3 Numerical Approximation of Integrals
Problems
-
- Use the trigonometric identity \(\cos^2 x = \frac{1}{2} (1+\cos\,2x)\) to calculate \(\displaystyle\int_0^{\,\pi/2} \cos^2\, x\,dx\) exactly.
 Estimate the integral in part (a) by left-hand and right-hand sums with four terms each. How close are your estimates to the exact answer?
- Estimate the integral in part (a) by midpoint and trapezoidal sums with four terms each. How close are your estimates to the exact answer?
- Estimate the integral in part (a) by Simpson's Rule, using the values of MR and TR from part (c). How close is your estimate to the exact answer?
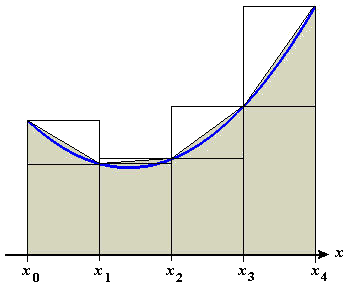
- Figure P1 shows four-step left-hand and right-hand
approximations to the area under the graph of a function \(f\) on an interval
\([a,b]\), where \(a=x_0\) and \(b=x_4\). Also shown are diagonal lines connecting
the points \((x_{i-1},f(x_{i-1}))\) and \((x_i,f(x_i))\)
on each subinterval.
- Explain why the area under each diagonal line is the average of the areas of the corresponding left-hand and right-hand rectangles.
- Explain why the Trapezoidal Rule has the name it has.

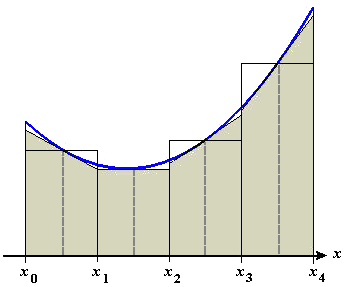
Figure P1 Averaging areas of left-hand and right-hand rectangles - Figure P2 shows a four-step midpoint approximation
to the area under the graph of a function \(f\) on an interval \([a,b]\), where
\(a=x_0\) and \(b=x_4\). Also shown are the tangent lines at the points \((\bar{x}_i, f(\bar{x}_i))\) on each subinterval. Explain why the area
under each tangent line is the same as the area of the corresponding midpoint
rectangle.

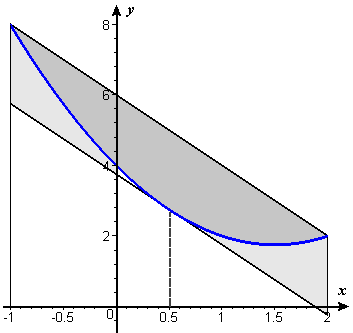
Figure P2 Interpreting midpoint areas as areas under tangent lines - Figure P3 shows the graph of the quadratic polynomial function \(f(x)=x^2-3x+4\)
on the interval \([-1,2]\), along with one-step trapezoidal and midpoint
approximations of area under the graph.
 Calculate the exact area under the graph
and the one-step trapezoidal and midpoint approximations.
Calculate the exact area under the graph
and the one-step trapezoidal and midpoint approximations.- Show that the error in the trapezoidal approximation is exactly twice the error in the midpoint approximation.

Figure P3 Errors in midpoint and trapezoidal approximations to the area under a parabola - Suppose \(f(x)=Ax^2+Bx+C\) is an arbitrary quadratic polynomial function and \([a,b]\) is an arbitrary interval.
- Calculate \(\displaystyle\int_a^{\,b} f(x)\,dx\).
- Calculate one-step trapezoidal and midpoint approximations to this integral.
- Show that the error in the trapezoidal approximation is exactly twice the error in the midpoint approximation.
- Explain why Simpson's Rule (for any number of steps) must give the exact value for the integral of any quadratic function.
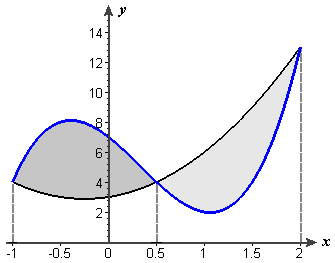
- Figure P4 shows the graph of \(f(x)=4x^3-4x^2-5x+7\) on the interval
\([-1,2]\), along with the graph of a quadratic function \(g\) that agrees
with \(f\) at \(-1\), at \(2\), and at the midpoint. That is, \(f(-1)=g(-1)\),
\(f(2)=g(2)\), and \(f(0.5)=g(0.5)\).
- Calculate \(\displaystyle\int_{-1}^{\,2} f(x)\,dx\).
 Calculate the one-step trapezoidal, midpoint, and Simpson approximations to this integral.
- According to the preceding problem, the Simpson approximation is exactly the area under the graph of \(g\). How does it compare to the area under the graph of \(f\)?
- Choose another interval \([a,b]\), and calculate both \(\displaystyle\int_a^{\,b} f(x)\,dx\) and a one-step Simpson approximation. How does the Simpson approximation compare with the exact value of the integral? (This result is no accident — it works the same way for all Simpson approximations to integrals of cubic functions.)

Figure P4 Errors in Simpson's Rule for area under a cubic polynomial
![]() Animation The pop-up animation illustrates geometrically how the Trapezoidal Rule "fills in" the region between the graph of \(f(x)\) and the \(x\)-axis as \(n\) increases.
Animation The pop-up animation illustrates geometrically how the Trapezoidal Rule "fills in" the region between the graph of \(f(x)\) and the \(x\)-axis as \(n\) increases.

