slope \(-2/3\)
Chapter 2
Models of Growth: Rates of Change
2.1 Rates of Change
Problems
-
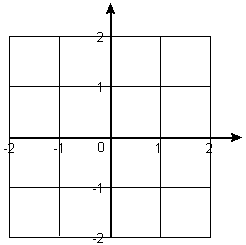
Draw a line with each of the indicated slopes. Start each part by making a grid like the one at the right on your paper — or, if you have a printer available, click on the figure to get a page you can print with four such grids.
- slope \(3/5\)
- slope \(-3/4\)
- slope \(-2\)
For each of the lines in the \(x\),\(y\)-plane in Problems 2-11:
- Find an equation of the line.
- Sketch the line. (If you need graph paper, you can make your own grid on notebook paper, or, if you have a printer available, click on the image at the right to get a page from which you can print your own.)
- Choose two \(x\) values, \(x_1\) and \(x_2\), and calculate \(\Delta y / \Delta x\). Then choose another pair of \(x\) values and calculate \(\Delta y / \Delta x\).
- The line with slope \(1.5\) through the point \((-1, 2.3)\).
- The line through the points \((2.1, 1.7)\) and \((-1.5, 4.2)\).
- The line with slope \(1 / 2\) through the point \((5,-2)\).
- The line through the points \((3,-7)\) and \((1,-3)\).
- The line with slope \(-1.7\) through the point \((1.5,-3.2)\).
- The line through the points \((1.3,-0.7)\) and \((1.5,-3.2)\).
- The line through the point \((12, 14)\) that is parallel to the \(x\)-axis.
- The line through the point \((5, 4)\) that is parallel to the line \(4x+5y=3\).
- The line through the point \((5, 4)\) that is parallel to the line through the points \((-1, 6)\) and \((5, 5)\).
- The line through the point \((-9, 11)\) that is parallel to the line \(2x-5y+7=0\).
-
 A common way to check the accuracy of your speedometer is to drive one or more measured miles, holding the speedometer at a constant 60 MPH and checking your watch at the start and end of the measured distance.
- Explain the method. How does your watch tell you whether the speedometer is accurate?
- Why shouldn't you use your odometer to measure the mile(s)?
- Make a table of the average rate of change of \(y=x^2\) over each of the following intervals: \([0,1]\), \([1,2]\), \([2,3]\), \([3,4]\).
- What pattern do you see? Explain this pattern by algebra.
- Make a table of the average rate of change of \(y=x^3\) over each of the following intervals: \([0,1]\), \([1,2]\), \([2,3]\), \([3,4]\).
- Can you find a pattern? Use algebra to confirm (or find) a pattern.


