Chapter 2
Models of Growth: Rates of Change
2.6 Logarithms and Representation of Data
We turn our attention now to an aspect of growth problems that is not addressed directly by the formal manipulations of calculus: Now that we have a model for growth of populations, how can we tell if biological populations actually grow that way? We will see that the same exponential and logarithmic functions help us answer this and related questions. More important, they provide a set of tools that we will continue to use throughout the course.
2.6.1 Logarithmic Plots of Data: Natural Base
Early in this chapter we considered Thomas Malthus's concept of human population growth, which we subsequently identified as exponential. Indeed, we have seen that the natural assumption about growth of biological populations (growth rate proportional to the population) leads to exponential functions representing population sizes. How can we tell whether populations really grow that way?
We consider two case studies. The first uses data on fruit flies in an ideal laboratory setting, and the other uses historical data on the human population of the earth. In each case we want to examine whether the data could have come from a population that is represented approximately by a function of the form .
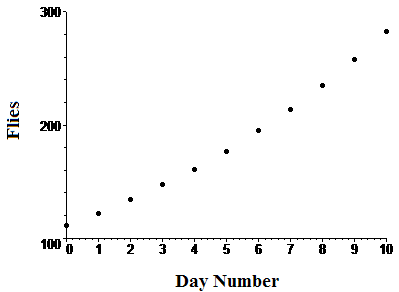
 Case Study 1 The following table lists numbers of fruit flies in a laboratory colony, under ideal conditions, for the first ten days of an experiment. Figure 1 is a plot of the same data.
|
 |
|||||||||||||||||||||||||
| Table 1 Fruit fly data | Figure 1 Fruit fly data |
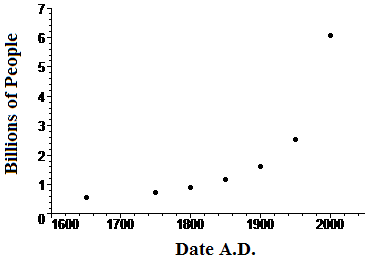
Case Study 2 The next table lists authoritative estimates of world population in the indicated years. Again, the figure is a plot of this data.
|
 |
|||||||||||||||||
| Table 2 World population | Figure 2 World population |
Imagine smooth curves connecting the data points in Figures 1 and 2. Could those curves be exponential? It's hard to be certain at this point - that's a question we have to investigate.
In your previous study of algebra, as well as in Chapter 1, you learned that taking logs is a good thing to do when confronted with problems involving exponents, and that's the kind of problem we have here. Recall the reason for this: “Taking logs” is defined by inversion (undoing) of exponentiation.
What happens if we take logs on both sides of the equation ? The answer to this question depends on properties of logarithmic functions that are the most important reasons for studying these functions: Logarithms turn products into sums and exponents into multipliers (see Problem 5). Because our exponent has base \(e\), we will use base \(e\) logarithms as well. Here is the calculation:
Activity 1
Use properties of logarithms to give reasons for each step in the calculation. Write a complete sentence for each reason.
The result of this calculation is that (log of the population) turns out to be a constant plus another constant \(k\) times \(t\). That is, the (natural) log of the population is a linear function of time! Now that's important, because it is easy to tell whether data points come from a linear function: Just plot them and see if they lie on a straight line.
Activity 2-
Use the Data Plot button to plot \(P\) (population) and \(\ln P\) (log of the population) as functions of time for the data in Case Study 1. Does the population grow exponentially?
-
Use the second Data Plot button to plot \(P\) (population) and \(\ln P\) (log of the population) as functions of time for the data in Case Study 2. Does the population grow exponentially?
-
If either population fails to grow exponentially, describe in your own words the way in which it fails to be exponential - for example, by growing too fast or too slow, or perhaps something else.
Day |
No. of Students Aware |
1 |
6 |
2 |
11 |
3 |
25 |
4 |
45 |
5 |
70 |
6 |
130 |
Students in a psychology class planted a rumor that all university classes would be canceled on the university president's sixtieth birthday. After the rumor had run its course, they gathered the data in Table 1 on the number of students aware of the rumor at the end of each of six days. Use the Data Plot tool to show that it is reasonable to say that the number of students aware of the rumor grew exponentially.
As we saw in Activity 3, the growth of the number of students aware of the rumor was approximately exponential. Now we will find an exponential function of the form
that models the data in Table 1.
As we have seen above, an equivalent equation is
so \(k\) should be the slope of the line on the \(\ln N\) plot. If we take the line determined by the first and last points, this makes
If we pick to fit the first data point, we have or
This makes our model function
Activity 4
Use our graphing tool to plot both the data and the model function. Experiment with different values for the constants \(k\) and . See if you can obtain values for the constants that produce a better model curve.
Image credit


