Chapter 5
Modeling with Differential Equations
Project 1: Hyperbolic and Inverse Hyperbolic Functions
- Introduction
- Why Are Hyperbolic Functions Important?
- More Hyperbolic Functions
- Inverse Hyperbolic Functions
Why Are Hyperbolic Functions Important?
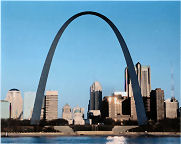
 Perhaps the best-known representation of a hyperbolic function is the Gateway Arch in St. Louis, MO (see image at right), which is in the shape of an upside-down hyperbolic cosine curve. It was constructed in the mid-1960's. We'll come back to the question of why it has that shape presently.
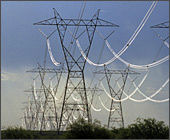
 The graph of \(y=\cosh\,x\) (and any variant obtained by scaling \(x\) and/or \(y\)) is called a catenary, from the Latin word catenaria, meaning "chain." It is, in fact, the shape in which a uniform chain or cable hangs when it is not supporting any added weights. The image at the left shows high voltage transmission lines, which have this characteristic shape.
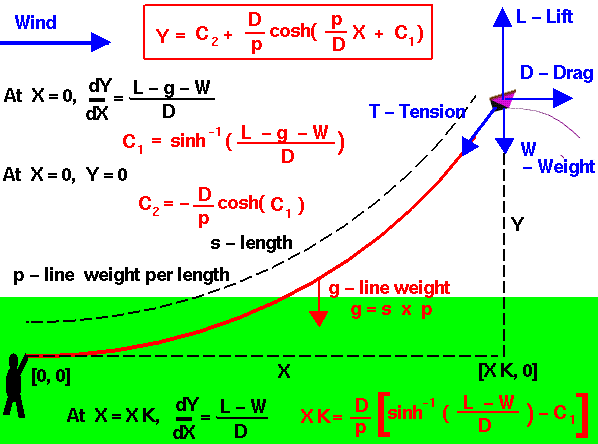
In Figure P2 we show diagramatically an example that may be more familiar, a kite string, essentially a very light "chain." This figure comes from another online activity provided by NASA to illustrate aerodynamic forces and Newton's Laws of Motion.

Figure P2 Sag in a kite control line
At the top of Figure P2, observe that a generic form for a hyperbolic cosine shape is set up with four parameters, \(C_1, C_2, D,\) and \(p\), where \(D\) is the drag force on the kite, \(p\) is the weight per unit length of the string, and \(C_1\) and \(C_2\) are determined from \(D\) and \(p\) together with the lift force \(L\) and the weight \(W\) of the kite. This is a four-parameter model, and thus four data points are needed to completely determine a formula for the string shape. The four data items selected are the values of \(Y\) and of \(dY/dX\) at the origin (kite-flyer's hand) and at the kite. The derivative \(dY/dX\) involves the hyperbolic sine, so relating its values to the parameters requires use of its inverse function \(\sinh^{-1}\). We will take up the inverses of hyperbolic functions in the fourth part of the Project. You will have an opportunity to carry out a similar curve fit in the last part.
Now we return to the St. Louis Gateway Arch and the reason for its shape. The catenary is the shape of a chain that supports only its own weight — it is said to be strictly in tension. An arch in the shape of an inverted catenary that supports only its own weight is strictly in compression, the opposite of tension. The shape is ideal in the sense that the arch experiences no shear forces.
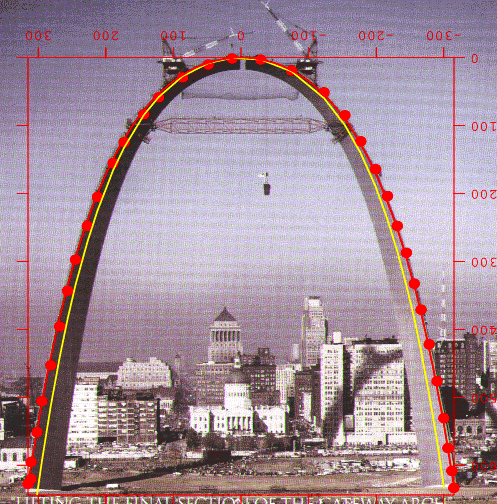
Figure P3 shows a scan from the cover of “The Building of the Arch” by Robert Artega, with curves and coordinate system superimposed. The picture was taken as the last segment of the arch was being put in place. The coordinate system (upside down and backwards), digitized points (red dots), and fitted red curve were added by physicist Alex Dzierba. The formula for his fitted curve is
\(y=75[\cosh\,(0.009x)-1]\).
Dzierba also added the yellow curve, which has the formula displayed on a plaque inside the arch:
\(y=68.8[\cosh\,(0.01x)-1]\).
The slight difference in these formulas is because Dzierba digitized the outside curve in the photo, and the other formula represents a curve passing through the center of each triangular cross-section of the arch.

Figure P3 St. Louis Gateway Arch with superimposed catenaries
In both formulas, the significance of subtracting \(1\) from the hyperbolic cosine is to place the peak of the arch at the origin of the coordinate system, since \(\cosh\,(0)=1\).
The arch appears to be taller than it is wide, but this is an optical illusion. In fact, it is \(630\) feet tall and \(630\) feet wide at the base. You can confirm that height and width are equal by measuring them on your computer screen.


